Christmas Bird Count history report system |
Christmas Bird Count history report system |
Refer to Section 4.4, “The detail history report” for definitions of terms and a general discussion of the layout of the detail report.
The first order of business is to design keys for the rows and columns that sort them into the proper order.
The standard presentation order for bird checklists
is a phylogenetic ordering. The xnomo3 system allows us to relate the CBC database's ( triple to a
taxonomic key number, which sorts in phylogenetic
order.
form, rel, altForm)
However, there may be many different kinds of birds referred to the same taxonomic key number. For example, a number of duck hybrids, such as Cinnamon × Blue-winged Teal or American × Eurasian Wigeon, will all be placed under the taxonomic key for genus Anas.
Hence, the row key will be a tuple (, where txKey, eng)txKeyeng"WIGEON, AMERICAN X WIGEON, EURASIAN").
The column key must sort columns into chronological sequence. Furthermore, it must do something sensible in the split-column presentation case, where there may be multiple columns with the same year.
Because the year_no field is in year-number format (see Section 14.4, “year-number”), it reliably sorts in
ascending order by year. If we stipulate these two
cases for the column key, the columns will be ordered
properly:
When a column contains data for multiple circles
in the same year, its column key will be just the
year_no field.
When a column presents data from only one circle
in one year, its column key is the concatenation
of the year_no+year_key fields
from the effort record.
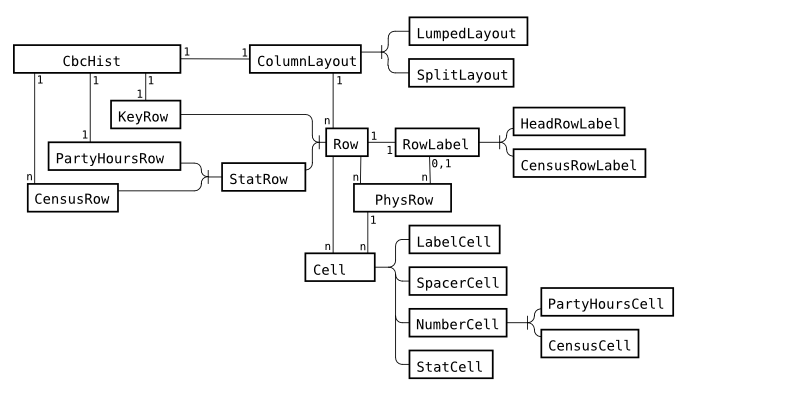
Here is how the various classes interrelate to produce the history detail report page.
CbcHist
Represents the entire history report.
ColumnLayout
Container for descriptions of the columns of one logical row. Determines which efforts are displayed in which logical rows.
This abstract class is implemented as two concrete
classes. LumpedLayout allocates columns
for the lumped-year option, and SplitLayout places each effort in a separate logical column.
Row
A base class for the various kinds of logical rows.
KeyRow
The logical row in the heading that displays the column's CBC year number and, in the split presentation, the year key.
StatRow
Base class for two kinds of rows for which we compute statistics.
PartyHoursRow
The logical row in the heading that displays the total party-hours of effort.
CensusRow
One of the logical rows in the table body that displays data for one kind of bird.
RowLabel
Base class for labels in the first column.
HeadRowLabel
Label for a heading row.
CensusRowLabel
A label for a kind of bird. For compound bird names (hybrids and species pairs), the relationship code and second name will always occur on a separate line, like this:
    Gadwall
    × Mallard
Cell
Base class for cells of the main table.
LabelCell
A table cell containing a column label.
SpacerCellA cell added between the last detail cell and the first suffix cell to satisfy the rule that the suffix cells must always occur at the end of the last physical row.
NumberCellA parent class for cells that are used as data values for the computation of means and standard deviations.
PartyHoursCell
A table cell containing a number of party-hours in float format.
CensusCell
A table cell that displays the numbers of one kind of bird. Internally, it holds four counts: regular, count-week, questionable, and questionable count-week.
StatCell
A table cell containing a statistic in float format, to be displayed in a distinct style so that it isn't likely to be confused with a census cell.
PhysRow
A container for one physical row. It contains one RowLabel (or None if this is a
continuation row), and a fixed number of cell slots,
each of which is a Cell instance.
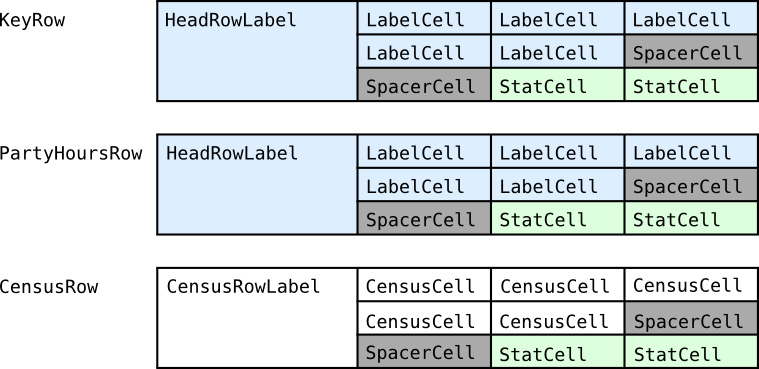
The figure above is an example of how a logical row might be folded into physical rows. For purposes of illustration, this table has only four columns, a row label plus three detail columns. Suppose the report covers five years; with the two statistics columns, that's a total of seven columns, so we'll need to fold each logical row into three physical rows, with two gray spacer cells added just before the statistics cells.